
eMotus
Designing and Prototyping an Interactive Installation.
Our Problem Area - Pedestrian Congestion:
As cities continue to expand and populations rise, the walkability of their inhabitants continues to become a pressing issue, creating stress, anxiety, and a lack of empathy for people in these urban environments.
To understand this, my team and I worked on understanding ways to increase walkability, and in this research discovered the impact of empathy towards others on the urban experience. Increasing this empathy whilst working towards other beneficial factors for walk appeal, we came up with our interactive emotion tracking and visualisation system, eMotus.

What is eMotus?
A system that detects the emotions of people that pass by, and converts this into their own personal colour of emotion; which is then contributed to a a live and dynamic art visualisation.
eMotus focuses on increasing the walk appeal of an area, through the use of a live visualisation, presenting real time information to people, as well as increasing the empathy towards others of people in these areas.
My Role:
With each aspect of the product, I was intrinsically involved, contributing to research, design, and overall management of our work.
Before we created the project, we had to first conceptualise the idea, starting with:
Research and Analysis:
After observations, interviews, researching case studies, surveys, statistical analysis and affinity diagramming, we came to a number of key points of interest within our problem area.
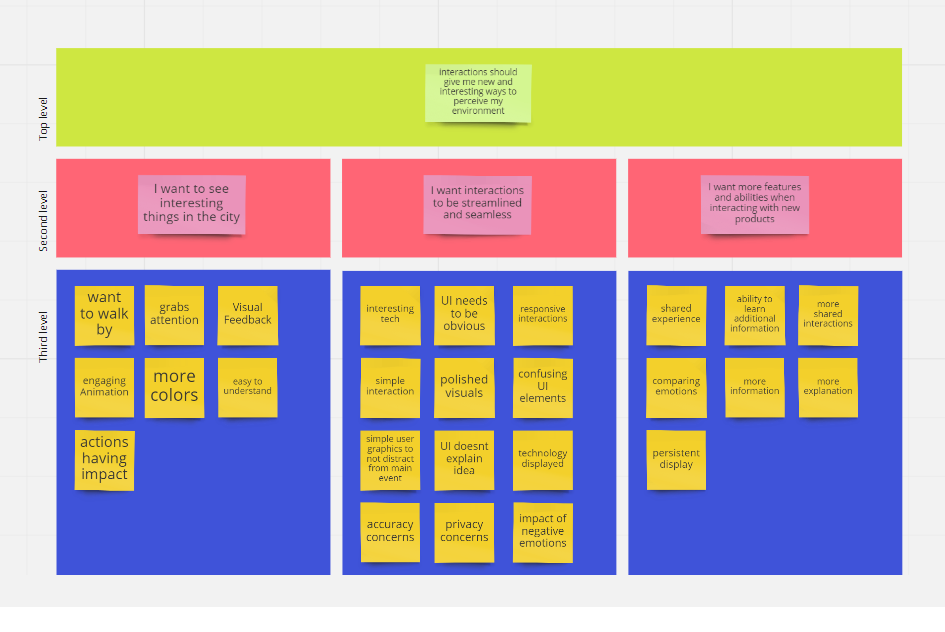
Affinity Diagram based on interviews
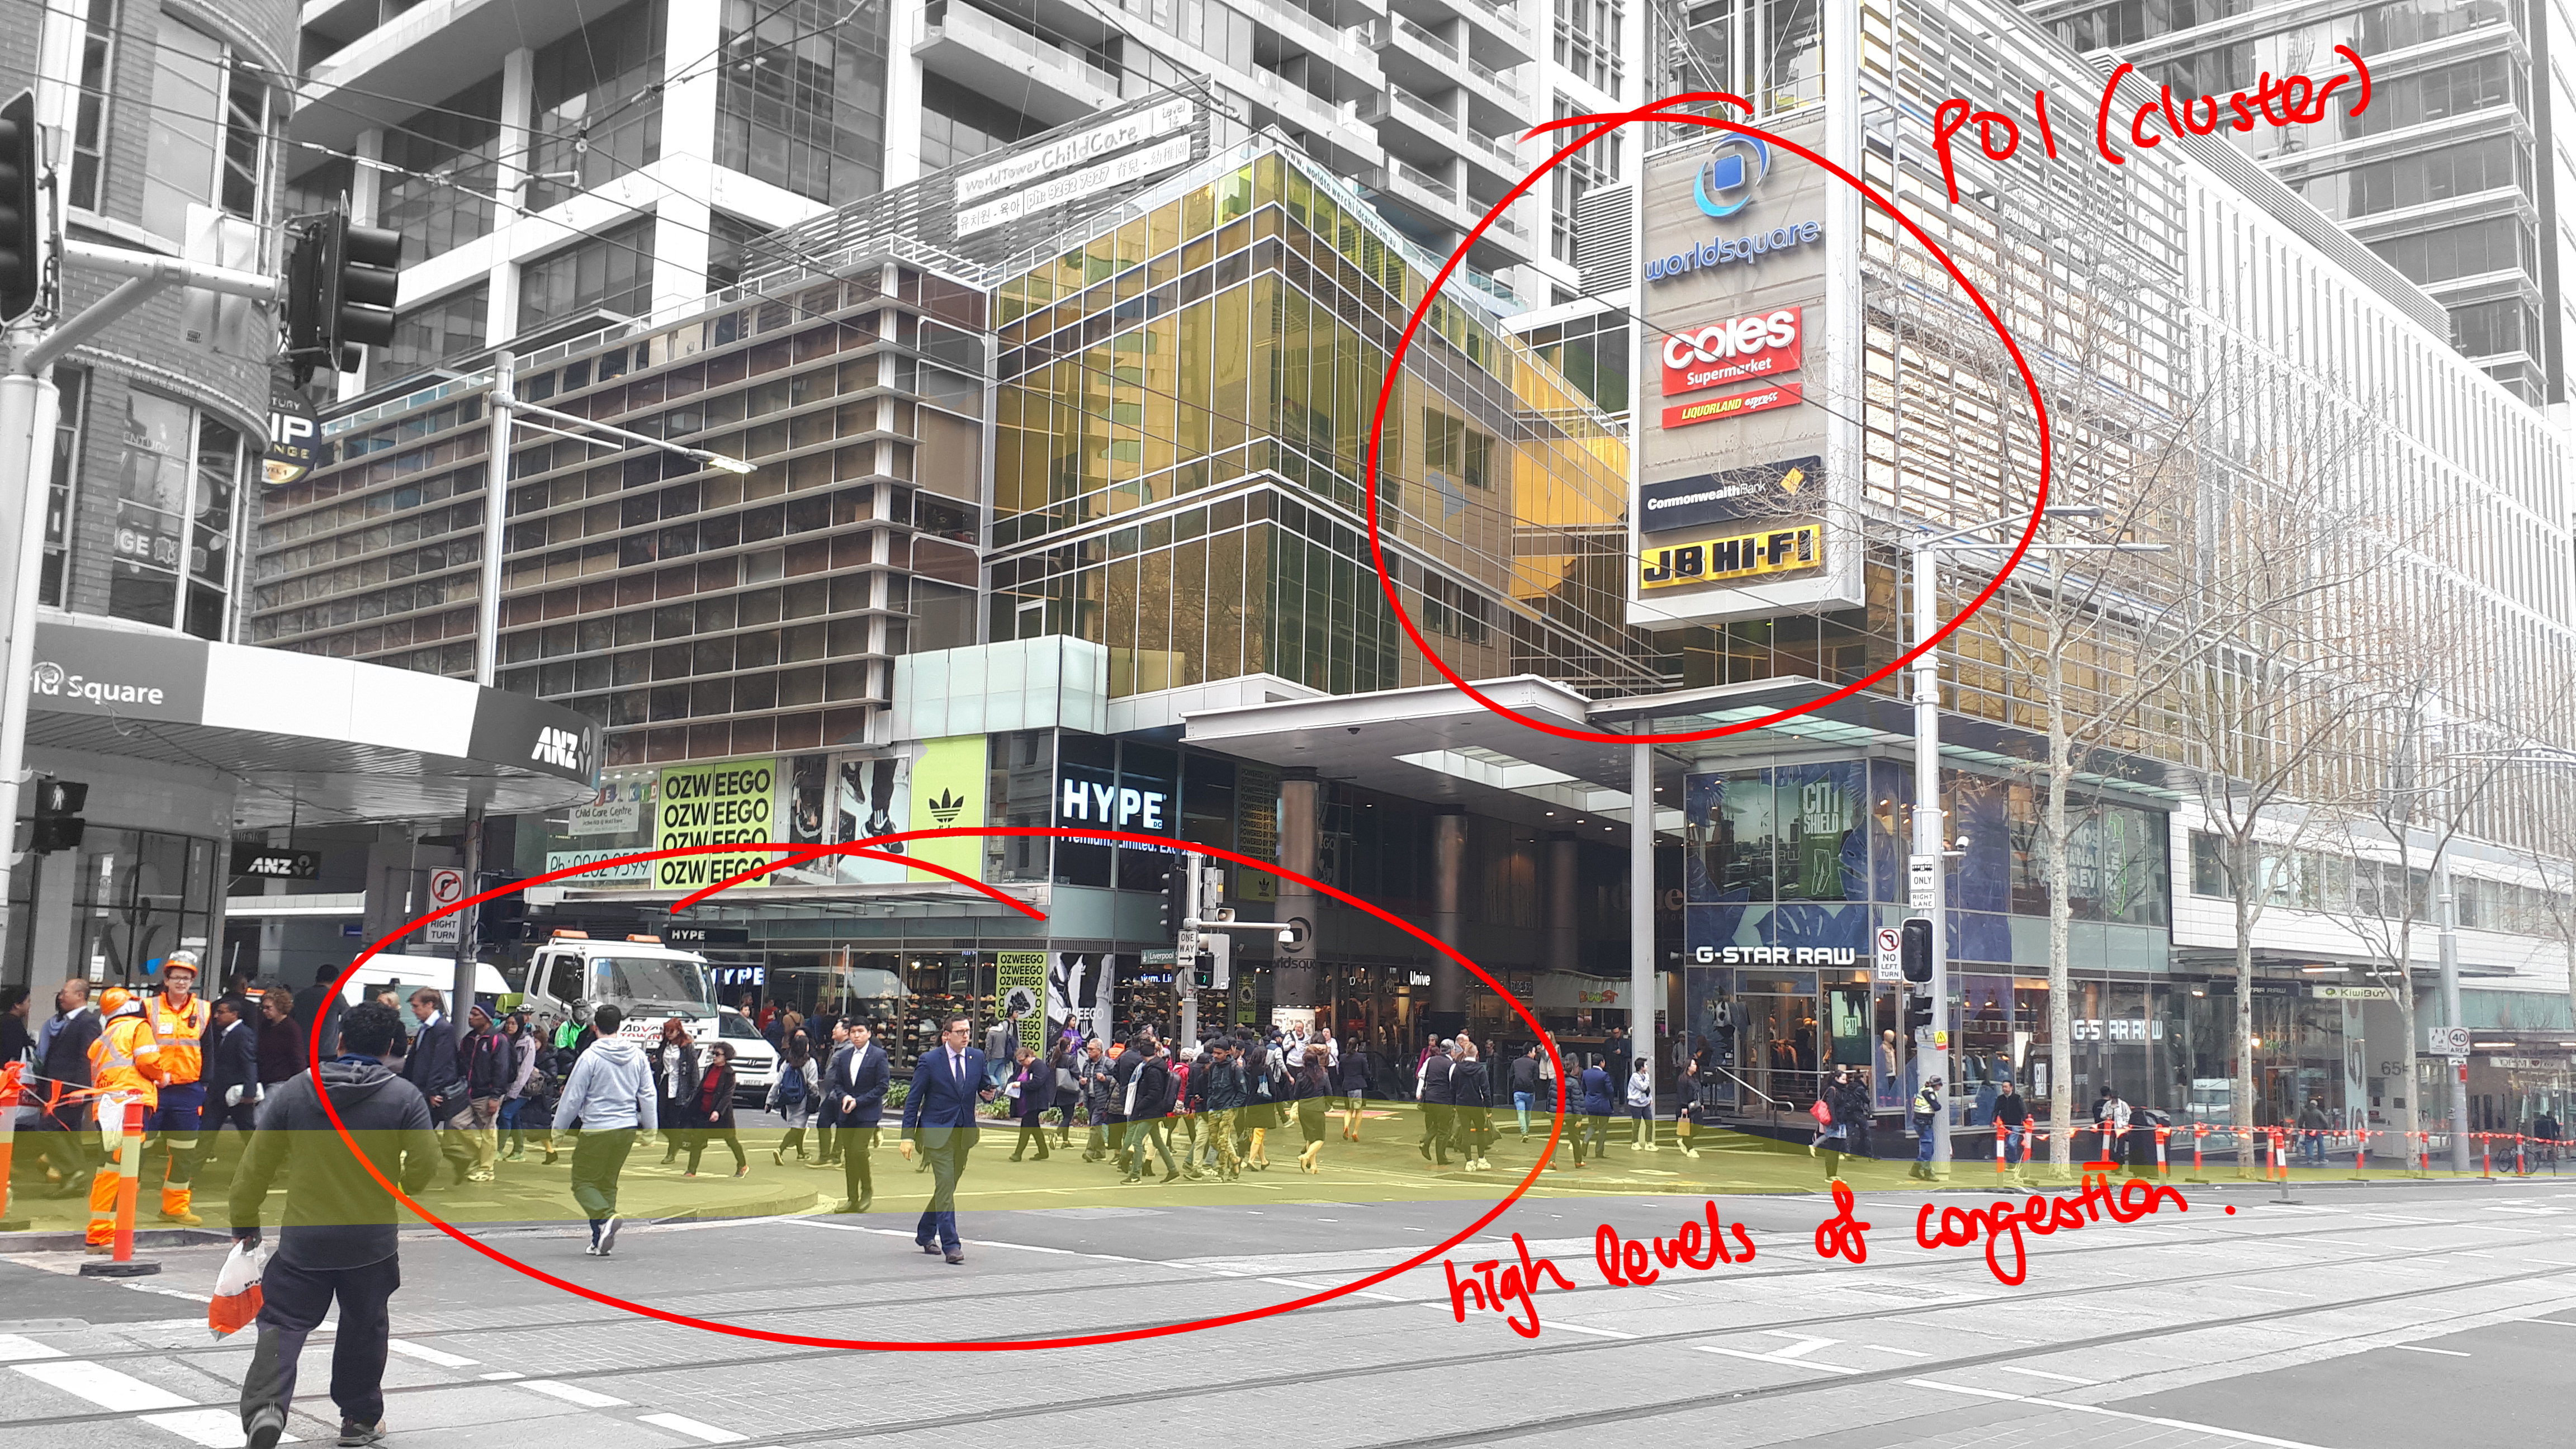
On site observations of foot traffic in Sydney CBD
People prefer to walk in areas where they feel safe, comfortable and easy to navigate.
These things are ultimately improved through increasing the walk appeal of an area, including visual variety and interest of an area, and by presenting information about things in the environment.
This research formed the basis of our concept generation and lead us to focusing on how people feel about urban environments and the factors that they consist of.
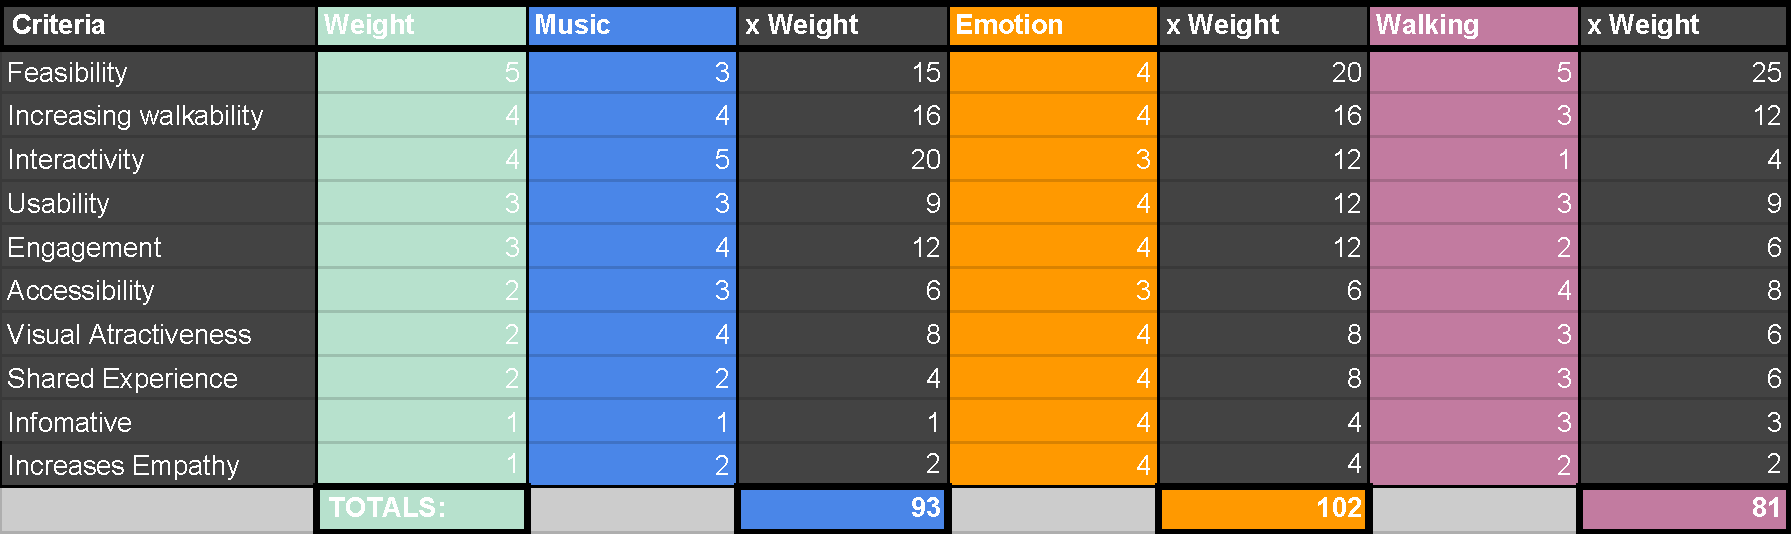
Concept Generation:
We came up with five initial concepts that formed the basis of eMotus, these five turning into three after assessing concept feasibility.
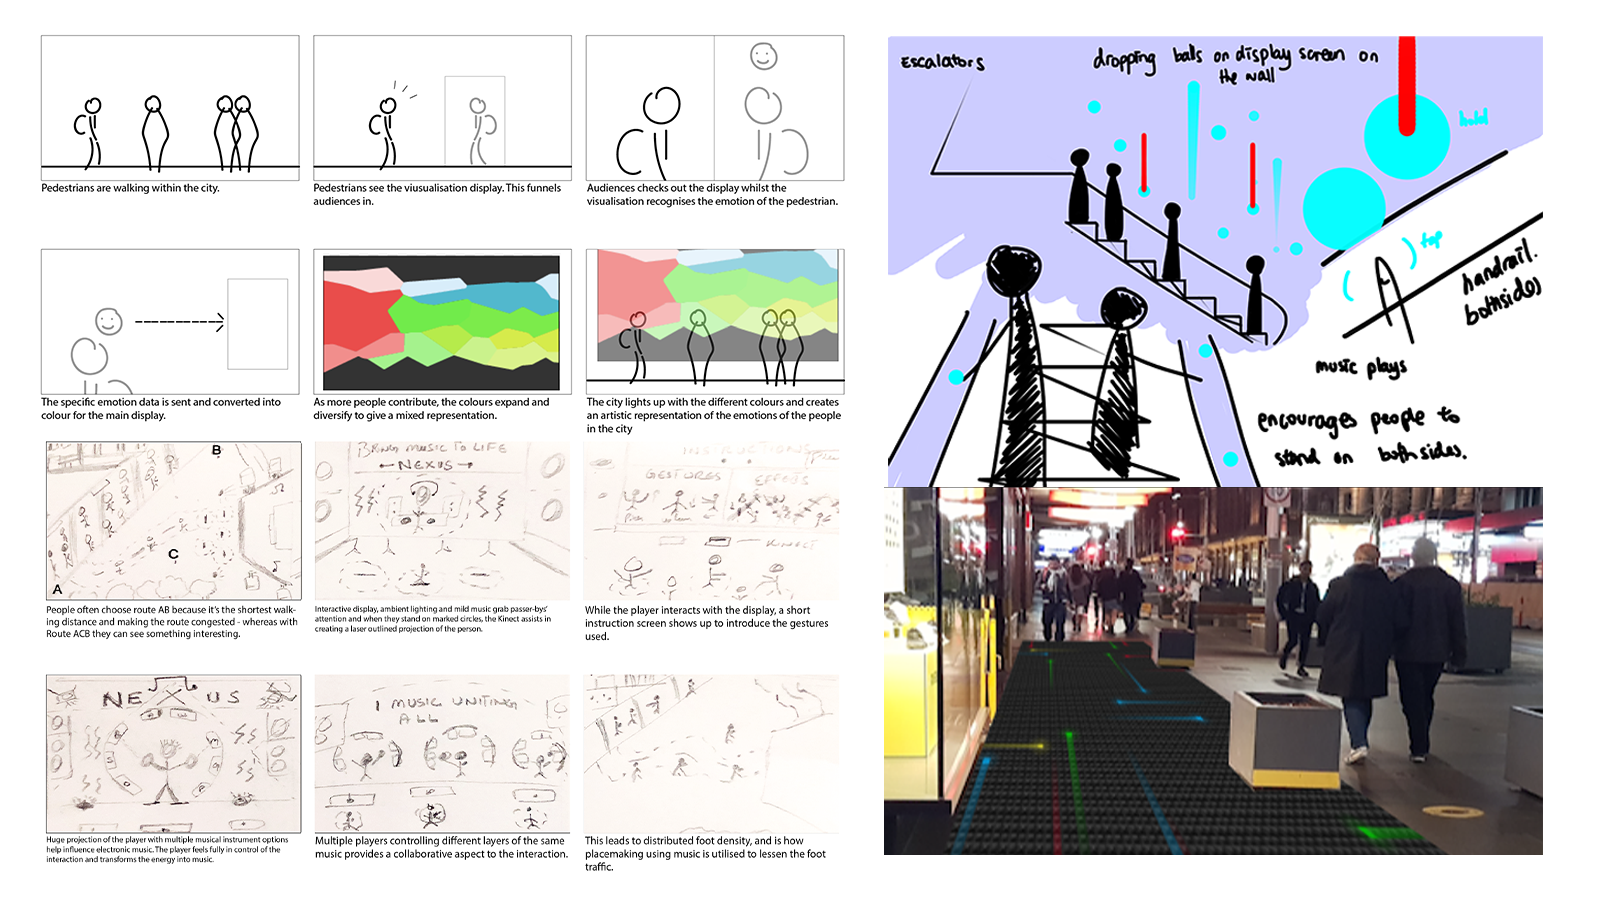
Storyboarding and concept sketching/visualising was a major factor in being able to bring our ideas to life.
Creating eMotus:
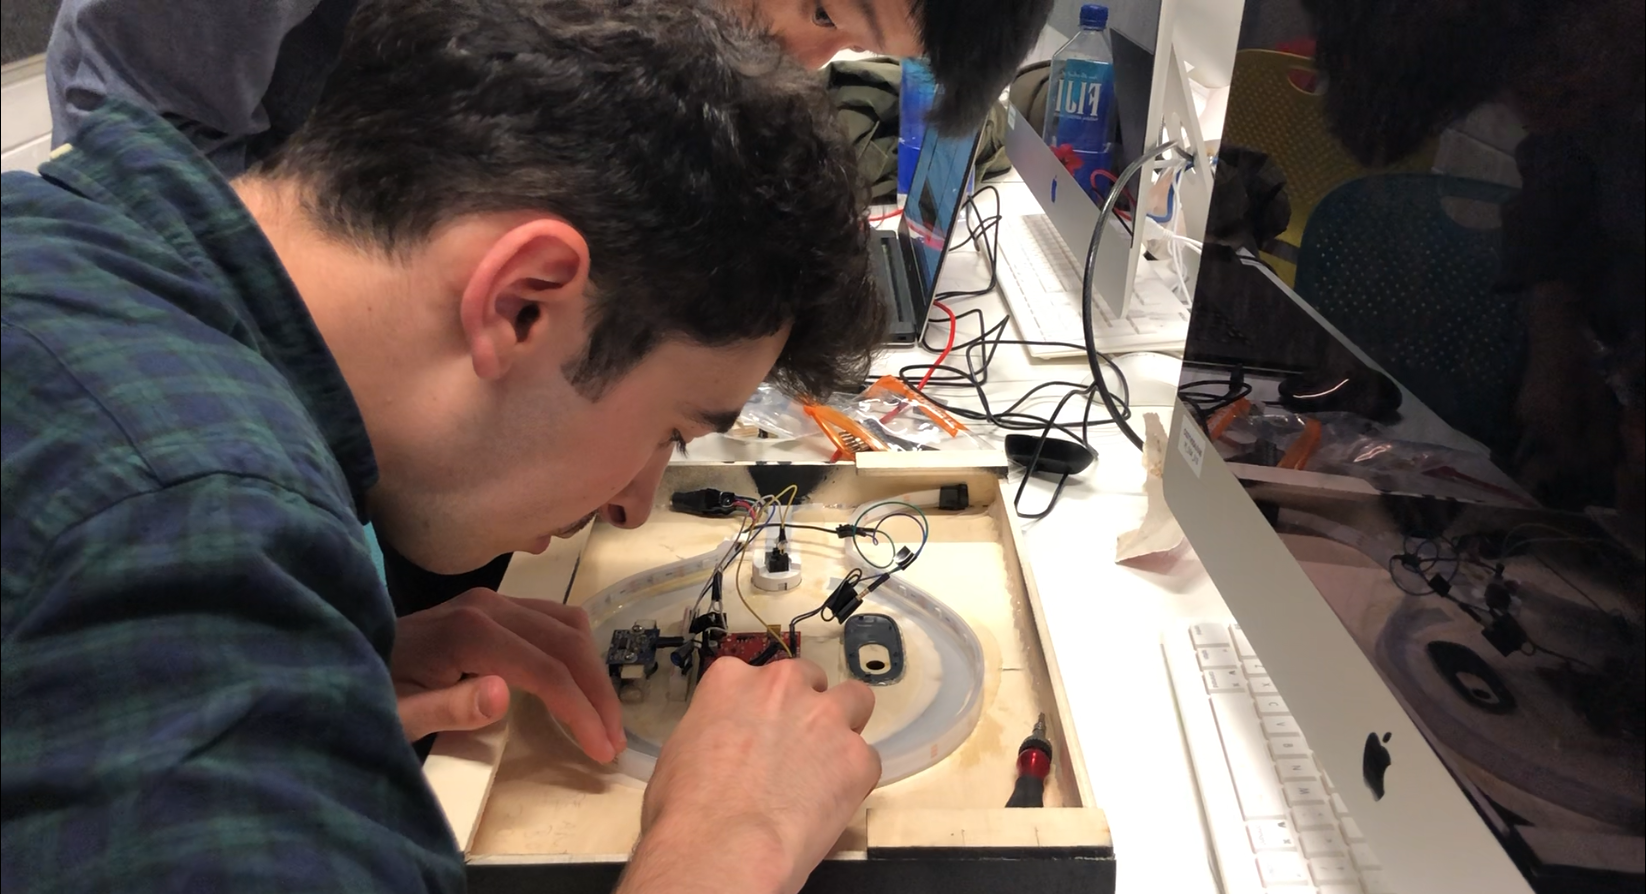
While the rest of the team worked on defining the visual aspects of the product, creating third party media, and organising testing and new ideas, I was responsible for the code that brings eMotus together, combining many different technologies, hardware and software, to create the product.
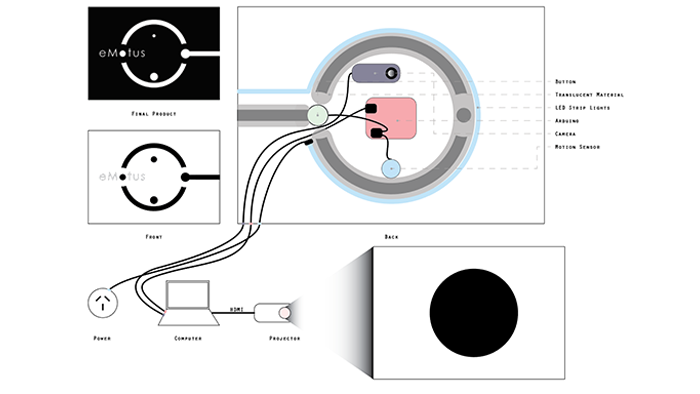
I took on a lot of the prototyping work, managed the project tasks and keeping us on schedule, as well as conceptualising and constructing the hardware for our interface. Primarily however, I was the lead programmer of the product, ensuring it functioned seamlessly and intuitively.
The code utilises Microsoft Azure ' s Face API, to recognise and determine the emotions of people. Written in C#, I created an application that captures and image of users and returns emotion values from the API.
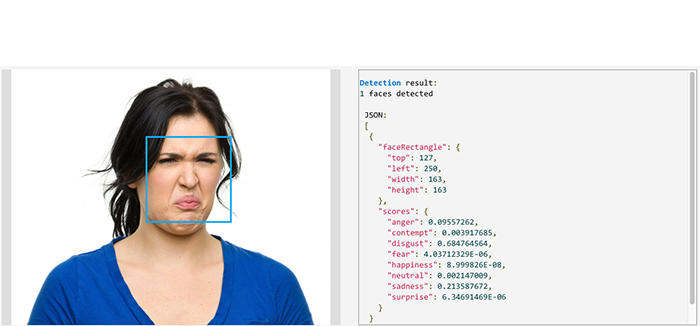
An example of the Emotion API data readings
Challenges:
WORKING IN TEAMS
We needed to create a product that was within our scope and ability, able to be completed in time and with the technology available.
FEASIBILITY
We wanted our product to be visually appealing and minimalist while still presenting the idea behind it and what it was about, without coming off as obnoxious or forceful.
COMMUNICATING OUR IDEA
We wanted our product to be visually appealing and minimalist while still presenting the idea behind it and what it was about, without coming off as obnoxious or forceful.
INTERFACE DESIGN
Our interface was one thing that came up in where the combination of media and how the physical interface connects to the digital one was not immediately clear.
EMOTION REPRESENTATION
People also did not immediately understand what the colour that was created for them meant, or even that it was generated specifically for them, leading to us creating more prompts and a legend for information.
Overcoming These Challenges:
COLLABORATION
Whenever we were stuck, we found that coming together as team allowed us to voice our problems and try to get alternate opinions or ideas on ways to solve them.
DIVIDING THE WORKLOAD
Utilising the resources and abilities of each of the members allowed us to continue to work on multiple aspects of the product at the same time, slowly bringing together a coherent and high fidelity product.
TESTING AND ITERATING
With each step taken in the product, we ran changes and ideas by the team and potential stakeholders to continue to add new and interesting ideas and components to the overall design
FUTURE WORK
As the product evolved, new and interesting ways to solve these problems arose, and will continue to arise as we work on the product more and more.
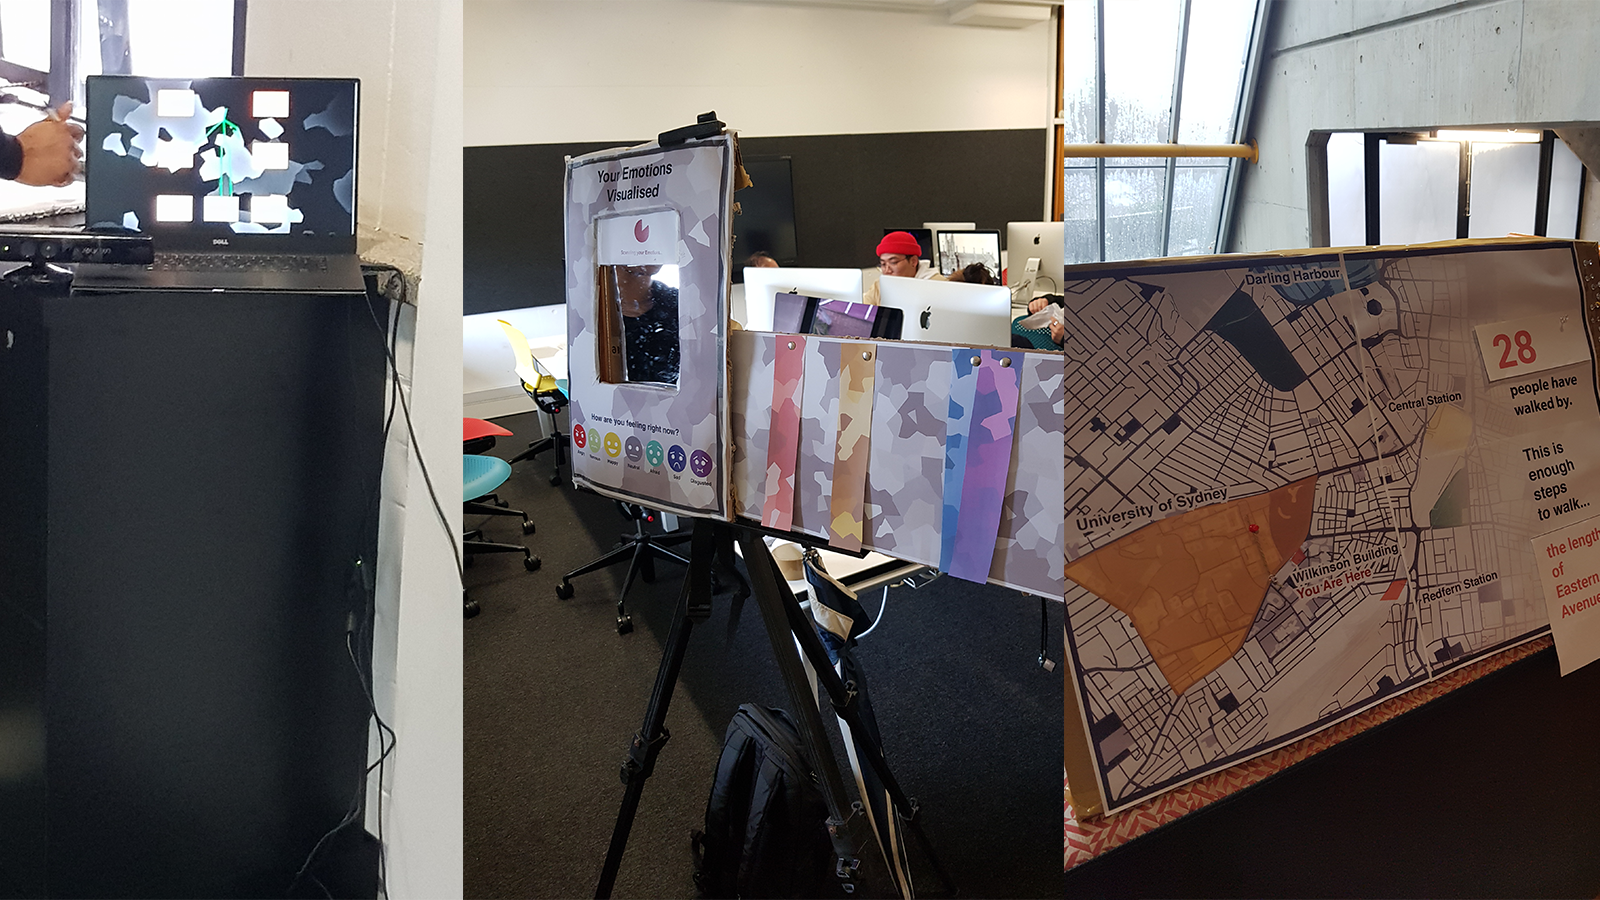
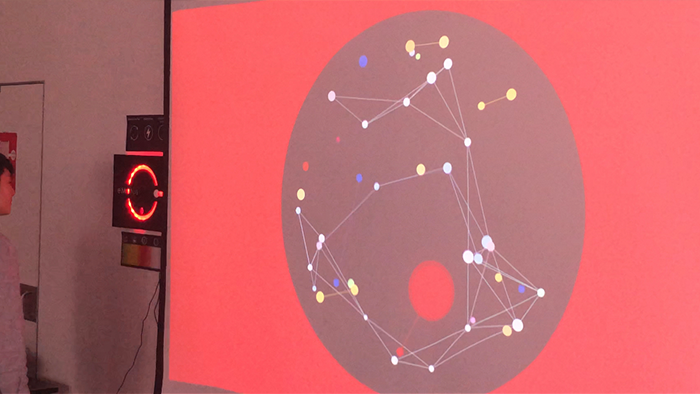
How it is Used:
Once we had finalised our prototype, we finally had people using it to its full ability.
People walk up to the interface which uses a motion sensor to detect their presence, and then capture an image to read their emotion. This image is sent to the Microsoft Azure API, where it is analysed and then deleted, and returns an emotion value as calculated by their face recognition algorithm. The interface then displays a colour that corresponds to their emotion, which, on the press of the button by the user, is sent to a large scale visualisation, a colourful montage of the emotions of all of the users that have engaged in the project.
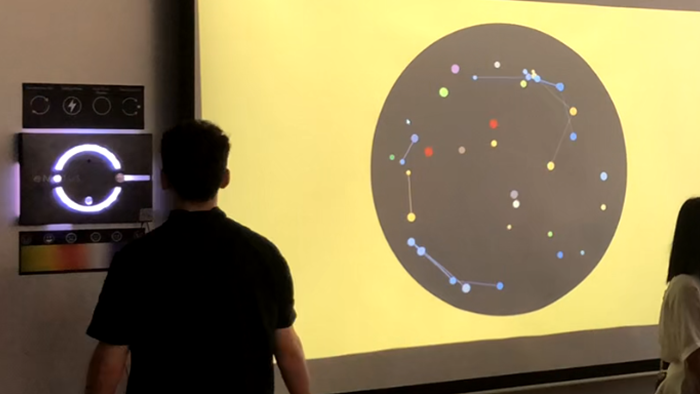
In practice, this collaboration of emotion instigates a collective artwork, increasing the interest in an area, and giving people a greater sense of community within their environment.
Reflecting on eMotus
Overall, the team worked really well together, especially while creating and putting together the prototype. By dividing the workload effectively, we were able to have multiple components come together at the same time, allowing the product to reach a higher fidelity than if it was brought together linearly.
The idea had a lot of room to grow, however I feel that the prototype we delivered was extremely high fidelity, and I look forward to any opportunities to work with mixed media installations like this in the future.
Back to top


